Bug #27124
[OEE][Overview/Machine] Quality section — ปรับกราฟ/ตารางให้ตรงกับ concept เดียวกับ Performance (#27123) #kiro
0%
Description
หน้า Machine Overview — ส่วน Quality ปรับตามรายละเอียดดังนี้ (concept เดียวกับ #27123 Performance section):
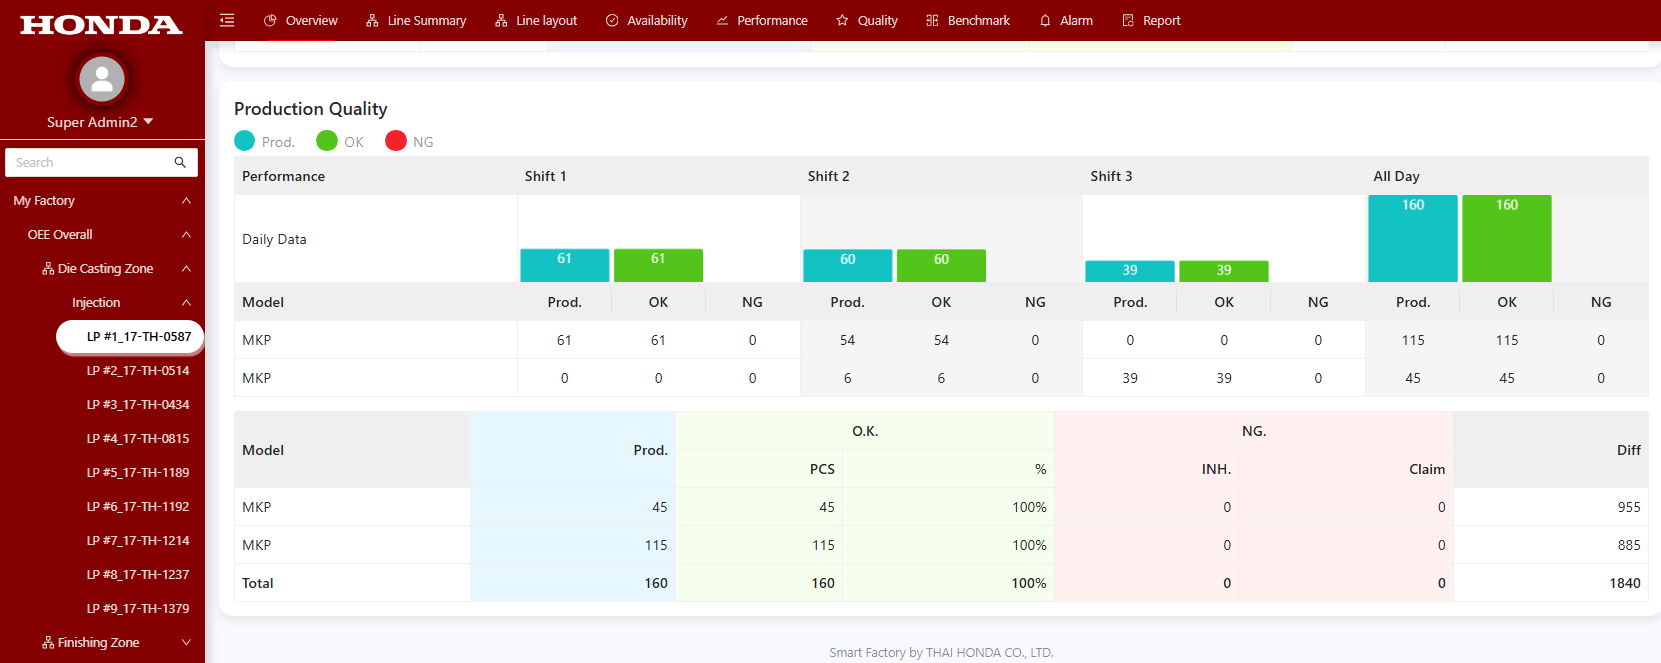
1. กราฟแท่ง (Daily Data แบ่งตามกะงาน)
- Prod. = P1 ตามกะงาน (อิงตาม logic ใหม่ของ #27105 ใช้ค่า `job.target` เต็ม ไม่ผันตามเวลา)
- แสดงตัวเลขรวมของแต่ละแท่ง บนแท่งกราฟ แทนด้านใน
- กรณี filter คร่อมหลายวัน (Weekly/Monthly/Custom) → sum ค่าตามช่วงเวลากะงานของแต่ละวันมาแสดงตามกะให้ถูกต้อง
2. ตารางบน (Model + Prod. / OK / NG แบ่งตามกะ)
- เพิ่มแสดง Job Name → format: `formula_name - job_name`
3. ตารางล่าง (Model / Prod. / O.K. PCS / O.K. % / NG INH. / NG Claim / Diff)
- Group by model (เช่น MKP แสดงแค่บรรทัดเดียว)
- Prod. = SUM ด้วย model
- O.K. PCS = SUM ด้วย model
- O.K. % = AVG ด้วย model
- NG INH. = SUM ด้วย model
- NG Claim = SUM ด้วย model
- Diff = SUM ด้วย model
4. ตรวจสอบค่าในตาราง
- ตรวจสอบว่าค่าที่แสดงถูกต้องและสอดคล้องกับข้อมูลจริง
ดู screenshot แนบประกอบ
Files
History
Updated by Supparoek Sariphan 15 days ago
- Status changed from New to In Progress
- นำ AI มาช่วย(%) changed from 0 to 100
Updated by Supparoek Sariphan 15 days ago
- Status changed from In Progress to Resolved
- Assignee changed from Supparoek Sariphan to Suphawan Phiwngam
Updated by Suphawan Phiwngam 13 days ago
- Status changed from Resolved to Feedback
- Assignee changed from Suphawan Phiwngam to Supparoek Sariphan
- Feedback
ปัญหาเดียวกับ #27123 (Performance section) ทุกประการ:
- 1. ตาราง Model บน (shift matrix) — แสดง job ไม่ครบ
ตารางบนดึง job จาก `shifts.quality_by_job` ซึ่งมีเฉพาะ job ที่มี actual production เท่านั้น → job ที่ actual=0 จะหายไป
ต้องการ: แสดง job ที่อยู่ในช่วง filter ทั้งหมด (แม้ actual=0 ก็ต้องแสดง)
- 2. Prod. ในกราฟแท่ง — ใช้ target เต็มไม่ผันตามเวลา
ปัจจุบัน Prod. ใช้ `p_ideal_target` ที่ aggregate ตาม overlap กับ shift window ทำให้ค่ากระจายตามกะ
ต้องการ: Prod. = target เต็มของ job ไม่แบ่งตามกะ (เหมือน PP ใน #27123)
- 3. กราฟเมื่อ filter คร่อมหลายวัน (Weekly / Monthly / Custom)
ให้ sample ข้อมูลตามช่วงเวลากะงานของแต่ละวันมา sum แสดงในกราฟตามกะให้ถูกต้อง ค่าที่แสดงต้องเป็นจำนวนเต็ม เพราะเป็นจำนวนชิ้น
Updated by Supparoek Sariphan 10 days ago
- Status changed from In Progress to Resolved
- Assignee changed from Supparoek Sariphan to Suphawan Phiwngam